Myer Mula1* and Kimberly Coronado2
1 Deputy Executive Director – Fertilizer and Pesticide Authority; National Program Director – Special Area for Agricultural Development (SAAD) Program; *Corresponding Author; email: dedfmyer.fpa@gmail.gov
2 Economist II – Fertilizer and Pesticide Authority, Department of Agriculture
Abstract
The Philippines, as a net importer of fertilizer, is vulnerable to the rising fertilizer prices due to Covid 19 pandemic causing fertilizer shortages around the globe, higher input costs and fuel prices, disruption of production and trade, including geopolitical disputes (Russia and Ukraine). The study was aimed to analyze fertilizer import prices and dealer prices to provide proposals for importation, marketing, pricing, and other policy recommendations.
Results reveal that import prices vary from country to country and started to increase in early 2021. From February to April 2022, the lowest average import price of Prilled Urea is from Uzbekistan ($648.00/MT), Granular Urea from China ($602.00/MT), Ammosul from Japan ($296.58/MT), Complete fertilizer from Korea ($608/MT), Ammophos from Korea ($490/MT), MOP from Jordan ($570.37/MT), and DAP from China ($900/MT), thus automatically affecting regional dealers prices due to archipelagic situation that entails additional logistical cost. Prilled Urea had the highest price in Region VI (Php 2,814.83) and the lowest in Region XIII (Php 2,536.11); Granular Urea was high in Region V (Php 2,826.33) and low in Region VII (Php 2,430.00); Ammosul was high in CAR (Php 1,533.65) and low in Region XI (Php 1,302.31); Complete fertilizer was high in CAR (Php 2,220.37) and low in Region XII (Php 1,793.50); Ammophos was high in Region V (Php 1,948.55) and low in Region XII (Php 1,583.54); MOP was highest in Region IX (Php 2,054.51) and lowest in Region II (Php 1,749.20); and DAP was highest in Region VII (Php 2,944.30) and lowest in Region VIII (Php 1,883.33). This indicates that average prices of different fertilizer grades are generally lower in nearby seaports (i.e. Regions III, XI, XII, and XIII).
Likewise, variation in dealer’s prices is influenced more by the company, brand and logistical cost hence, the incorporation of Suggested Retail Price (SRP) and Maximum Retail Price (MRP) should be calculated based on the source of origin and be institutionalized by the Department of Agriculture (DA) and Department of Trade and Industry (DTI) centered on the location where the fertilizers are locally sold, and the government should open up bilateral agreement with countries (G2G) producing fertilizers for lesser acquisition cost.
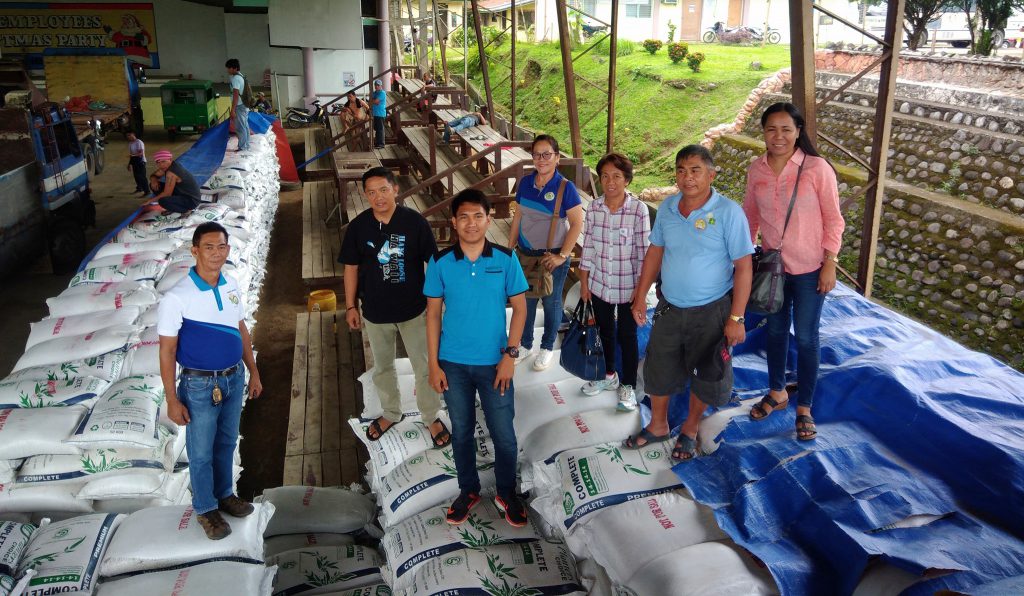
In recent months we witnessed a sharp increase in fertilizer prices worldwide. International prices of urea rose from $216/MT in June 2020 to $393.25/MT in June 2021, while prices of diammonium phosphate (DAP) soared from $263/MT in June 2020 to $604.75/MT during the same period of 2021 (Baffes and Koh, 2021). Global fertilizer prices increased during 2021 with limited supply brought about by the disruption of production and transportation due to the COVID-19 pandemic, higher input costs, hike in fuel prices, trade disputes and geopolitics, and the recent Russia invading Ukraine (Roldan et. al. 2021).
Countries (i.e., Australia, Brazil, India) also increased their fertilizer demand to stimulate local agricultural production, China even banned export of their fertilizer products (Mula, 2022). The situation was further aggravated by the conflict in Ukraine and the sanctions imposed by Western countries on Russia and Belarus.
Import prices remained volatile but are generally increasing, regardless of country of origin. The trend of average local dealers’ prices per month from 2019 to 2021 (Month 1 to 36), covering the pre-pandemic period to the height of global lockdowns to the gradual easing of quarantine restrictions is shown in Figure 1. Fertilizer prices in the Philippines started to increase during the mid-year (Month 19) of 2021 and further surged towards the end of the year (Month 24). While fertilizer prices are volatile, a relatively steady trend is observed until mid of 2021 (Month 1 to 18). During the stringent lockdown in the country in 2020 (Month 15), local prices of fertilizers remained close to the 2019 prices (Month 1 to 12); the price of urea even declined. Around May-June 2021 (Months 29 & 30), prices for all fertilizer grades started to increase and further surged towards December (Month 36).
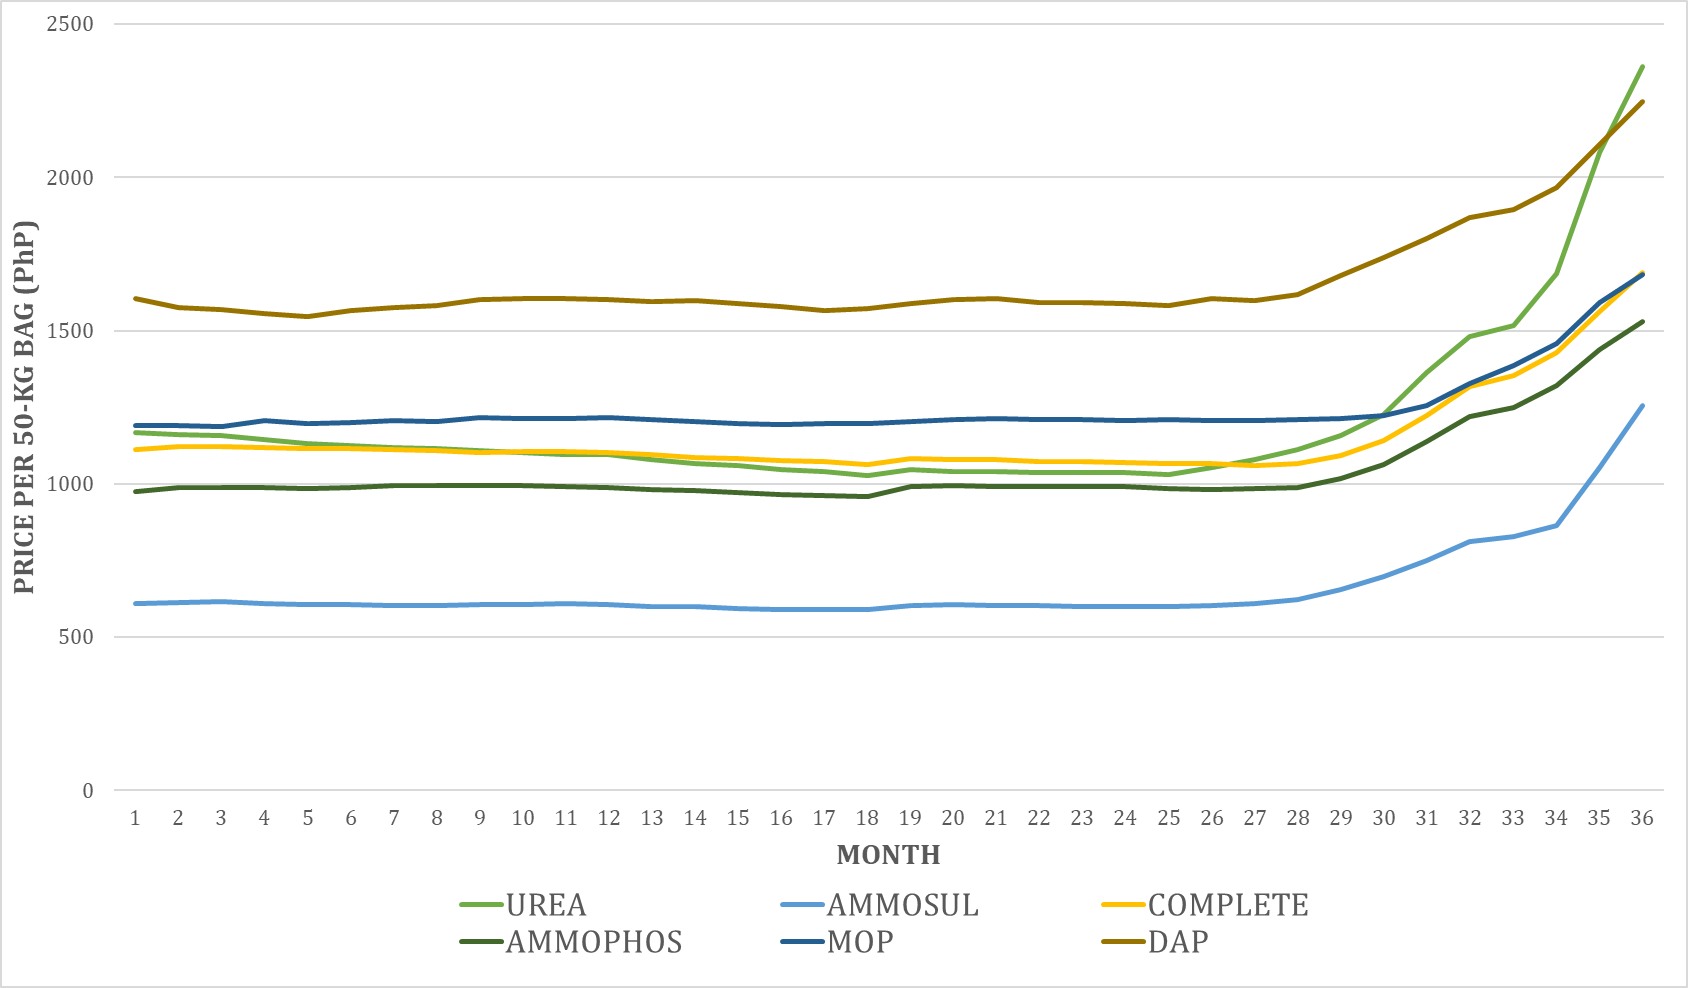
The price of urea during November 2020 (Month 23) recorded an average of Php 1,037.83 per 50-kg bag as compared to the November 2021 (Month 35) record of Php 2,082.14, indicating a hundred percent increase in a year. This was further increased in the following month (Month 36), reporting a 128% increase in price compared to December 2020 price (Month 24).
Ammonium sulfate price also increased by 109% in December 2021 (Month 36), compared to the same period of the previous year (Month 24). Ammonium phosphate and complete fertilizer posted more than 50% increase in price, while muriate of potash and diammonium phosphate prices have increased at around 40%.
Ultimately, this could initiate changes in cropping patterns and affect the country’s overall crop production. Farmers would likewise lessen fertilizer application, or decline their area planted. Challenges such as diminishing farm size, population growth, and climate change also adversely affect productivity.
The Philippines, being a net importer of fertilizer, is vulnerable to the shifts in the global market. Different chemical fertilizer grades are imported into the country from various countries. The primary sources of our fertilizer imports from 2018 to 2021 are China (40.66%), Indonesia (16.70%), Malaysia (12.20%), Qatar (7.37%), Canada (6.18%), and Japan (5.88%), according to the FPA 2021 data. Fertilizer imports from various countries also come with varying import prices.
However, the fertilizer peg at dealer prices is computed at the average notwithstanding where the origin of fertilizer comes from. Local fertilizer prices are only monitored at the dealer level and there is no data on fertilizer prices at the distributor level. Hence, comparison of fertilizer dealer prices per country of origin should be analyzed to determine if the trend of import prices is reflected in the local market. This study tends to analyze the import prices and dealer prices of the six major fertilizer grades from the month of February to April 2022, also provide proposals for fertilizer importation, a system of retailing monitoring, and other policy recommendations.
Methodology
The fertilizer importation data by country of origin and regional fertilizer dealer prices were analyzed to provide decision-making and policy direction of the Department of Agriculture (DA).
Data on regional dealer prices of the seven major fertilizer grades: prilled and granular urea (46-0-0), ammonium sulfate (21-0-0), complete fertilizer (14-14-14), ammonium phosphate (16-20-0), muriate of potash (0-0-60), and diammonium phosphate (18-46-0), and fertilizer importation data are obtained through the Fertilizer and Pesticide Authority (FPA) database on weekly bases. The data on fertilizer importation are taken from the VAT exemption invoices issued to the importers by the FPA.
These data are analyzed to investigate price trends, compare fertilizer import prices per country of origin, and compare dealer prices per region, country of origin, and brand.
Since local fertilizer price is only monitored at the dealer’s level, there is no data on the fertilizer prices at the distributor or wholesale level. A profit margin matrix was used to approximate fertilizer prices along the supply chain (Appendix 1 – Computation of fertilizer price matrix at various cost levels). The estimations in this matrix came from the fertilizer industry stakeholders.
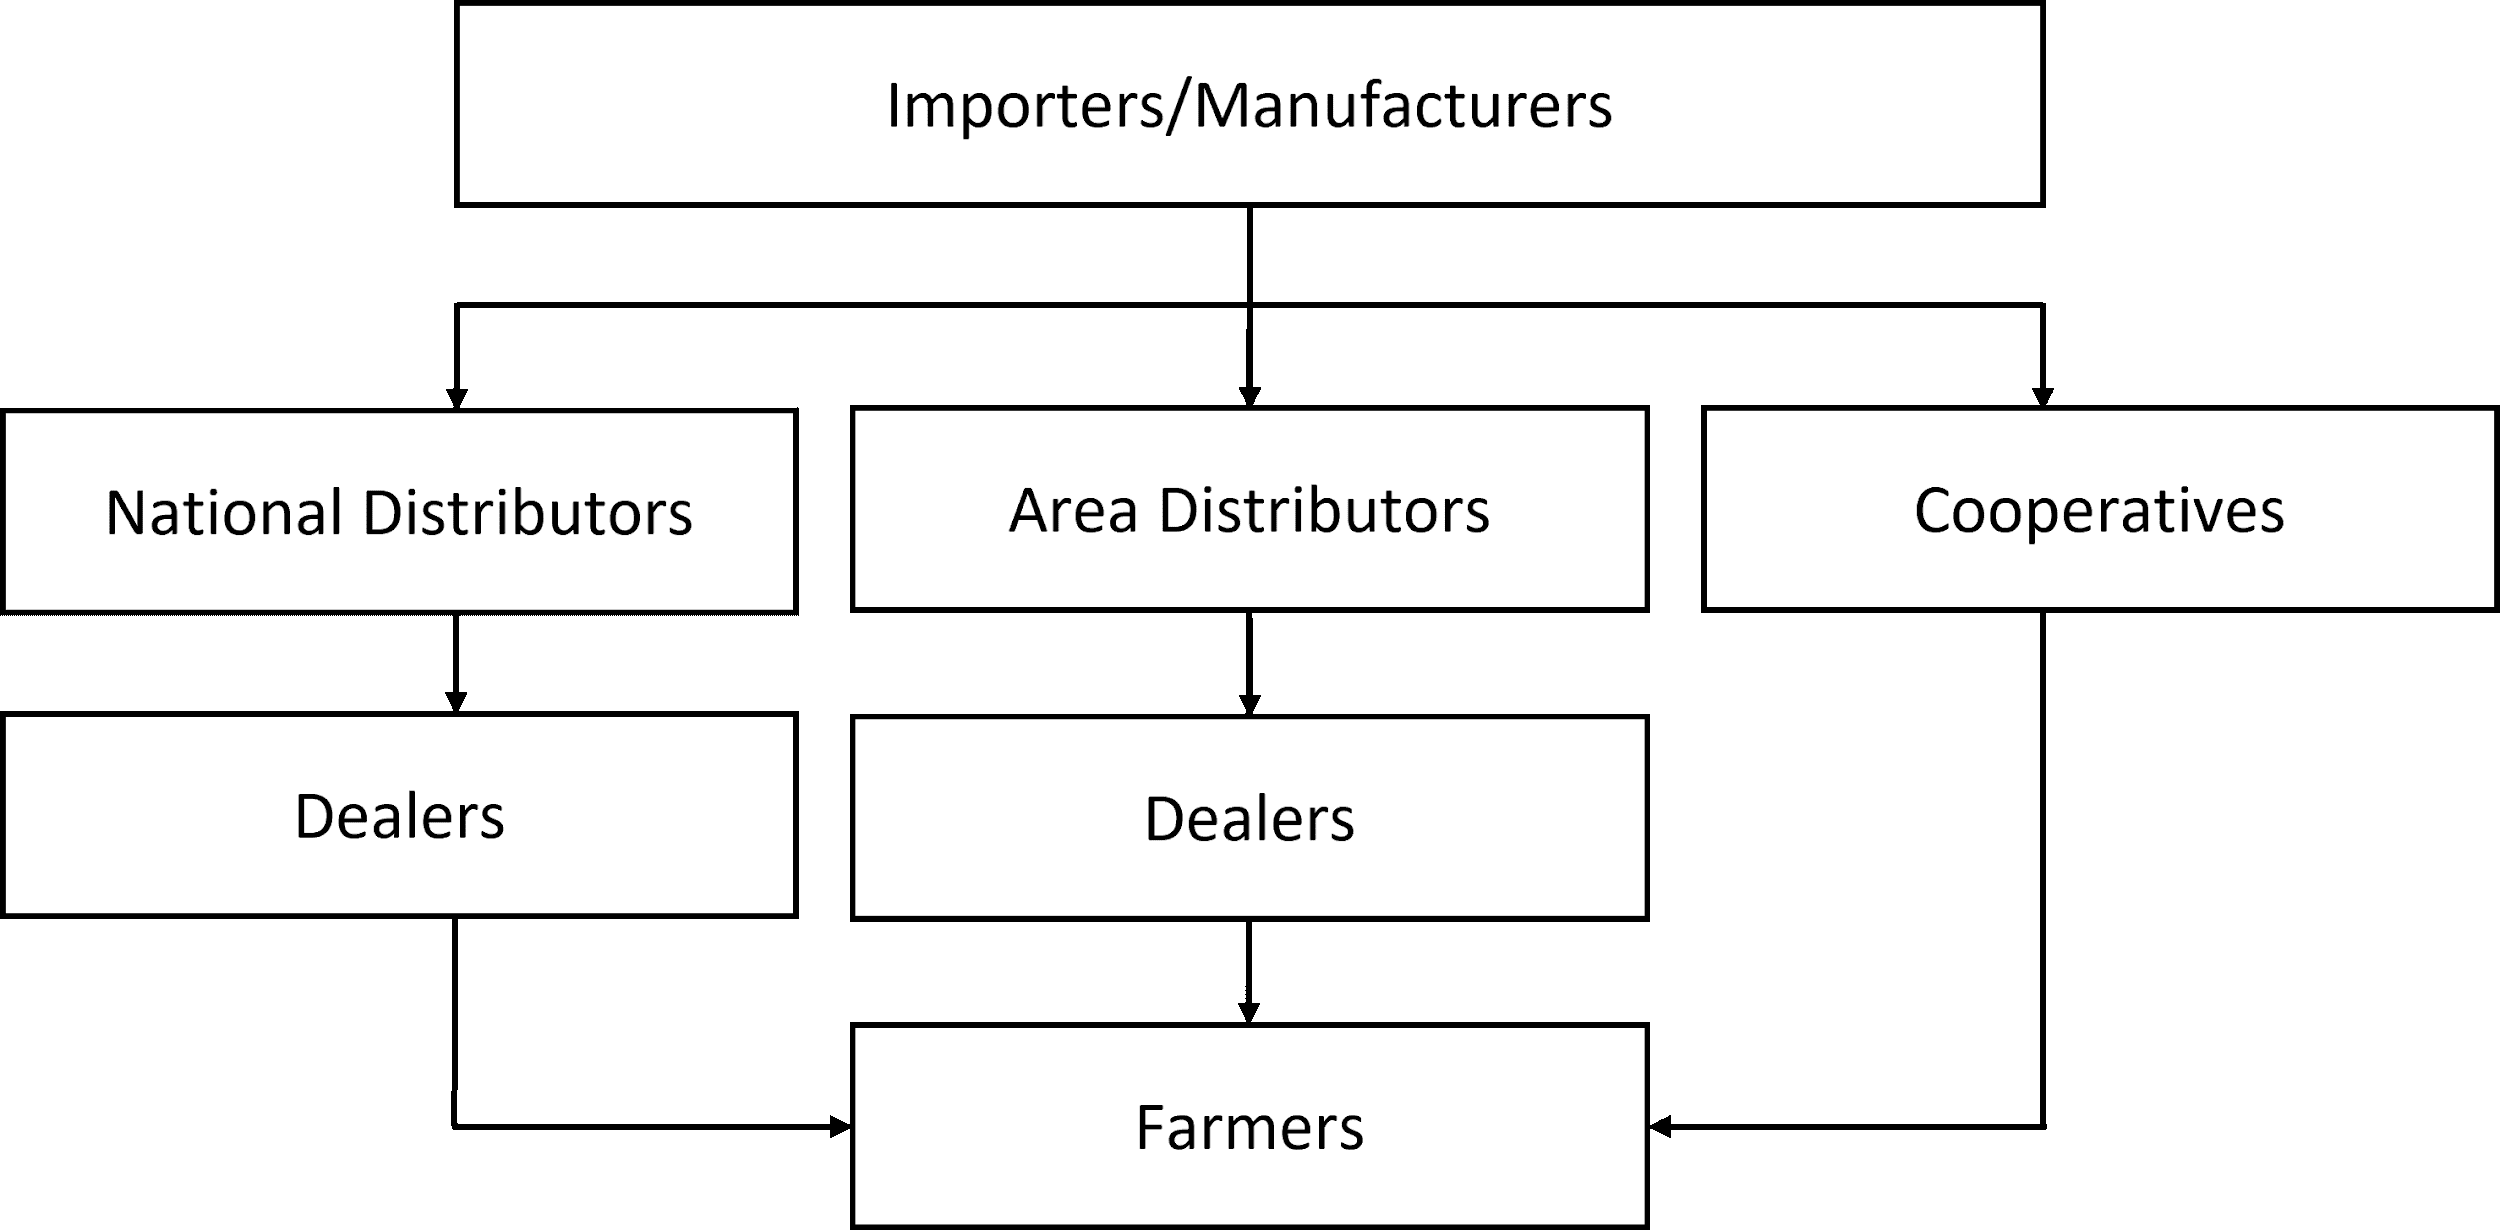
Import prices are in US$ per unit MT (CFR values) of fertilizer. Payments for duties and other port costs are added to the import price to give the landed cost upon disport. These costs are estimated to be Php 90.00 per 50-kg bag of fertilizer. Importers then add imputed costs for trucking, warehousing, labor, tax (2.5%), and profit per bag (8%). The distributor’s price to the dealer adds to the price by following the same margin estimates as the importers. Lastly, the dealer’s price covers an additional cost for only trucking and labor, plus the tax (2.5%) and profit per bag (8%) (Appendix 1 and Figure 2).
Figure 2 presents the imputed costs of fertilizer prices along the supply chain. From the import price, costs are added to the fertilizer price in every market channel (Figure 3) and eventually come up with the dealer’s price – the retail price of fertilizer availed by the farmer end-users.

Import prices will be compared depending on the country of origin to determine the source country with the lowest prices of fertilizer imports. On the other hand, comparison of dealer prices is to be assessed by country of origin, region of sale, and brand.
Results and Discussions
Price status of 7 major traditional fertilizer (February-April 2022)
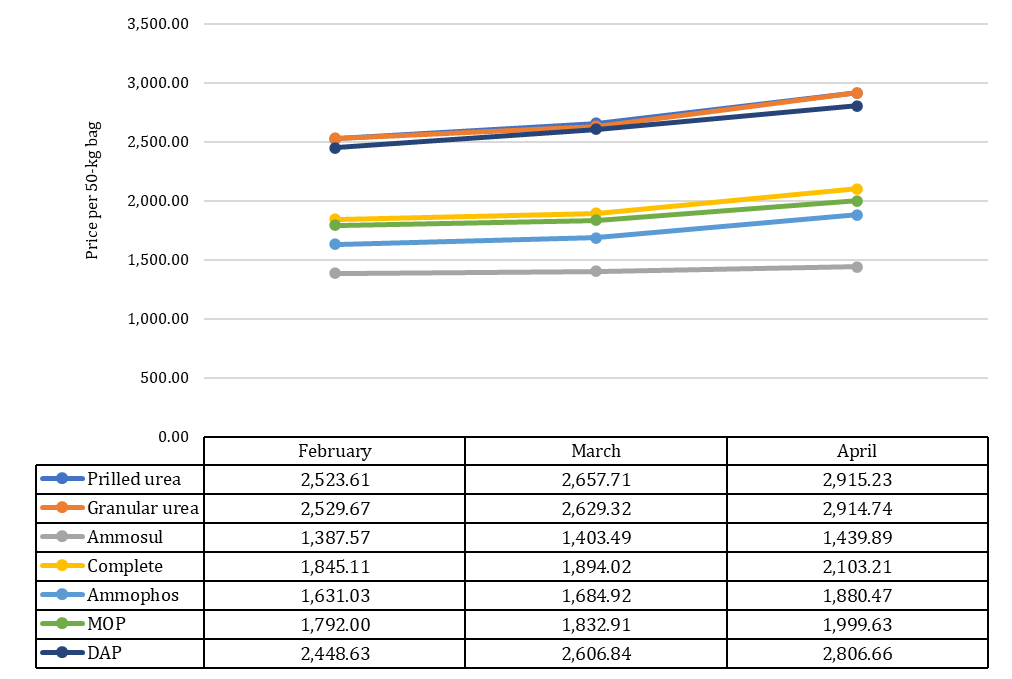
Prices of fertilizer had been increasing since mid-2021 and soared especially at the end of the year. From February to April of 2022, import prices remained volatile and in upward trend regardless of country of origin. On the local retail level, average prices are observed to be increasing over the months (Figure 4). However, the movement of prices from the retail or dealer’s level does not directly reflect the movement of import prices (Appendices 2-8).
The effect of Origin and Branding
Assessing the fertilizer prices per brand at the regional level can be inferred the differences in prices (Appendices 9-20). The same fertilizer grade with the same brand could have varying prices in the same month, depending on the country of origin and the region of sale.
For example, in Region VII, complete fertilizer Atlas from China has a dealer price of Php 1,946.28 in April. The same brand sold in the same region but is from Korea has a dealer price of Php 1,960.63. In Region XI, the same Atlas complete fertilizer from China posted Php 1,820.00 per bag. One brand of fertilizer could also appear to be more expensive than other brands but could still be cheaper at some point due to varying prices depending on its country of origin and region. In April prices of MOP from Canada in Region IV, brand Amigo (Php 2,026.34) is more expensive than Atlas (Php 1,912.50). However, in Region XI, Amigo (Php 1,917.50) is cheaper than Atlas (Php 1,966.82).
The country of origin depends on the import price of the fertilizer, while region of sale could be attributed to the far proximity from ports, distance from ports and large distributors, and the number of handlers.
Import and Regional Dealer Prices
Prilled Urea
Import Price
The highest volume of prilled urea imported was from Indonesia with 22,445.03 MT or 42.82%, followed by Qatar (21,999 MT or 41.98%) (Table 1). Meanwhile, import prices from Uzbekistan are the lowest at $648.00 per MT, followed by Indonesia ($690.71/MT). Prilled urea from Vietnam has the most expensive price per metric ton at $942.50.
Table 1. Import price and volume of prilled urea, February to April 2022.

On the regional average dealer prices of prilled urea, the highest price in February was noted in Region V (Php 2,673.523), Region VI in March and April at Php 2906.15 and Php 3,118.19, respectively. While the lowest prices were recorded in Region I (February – Php 2,380.00) and REGION XIII (March – Php 2,474.31 and April – Php 2,646.24) (Table 2).
Table 2. Regional dealer prices of prilled urea, February to April 2022.

Granular Urea
Import Price
Granular urea imports’ highest volume is Indonesia, with 39,104.60 MT or 42.92%, followed by Qatar with 22,000.00 MT or 24.15%. Regarding import prices, the highest price is Qatar with an average of $882.43/MT, while the lowest is from China at $602.00/MT (Table 3).
Table 3. Import price and volume of granular urea, February to April 2022.

The highest average dealer prices of granular urea were observed in Region IV (February – Php 2,723.00), in Region XIII (March – Php 2,847.29), and in CAR (April – Php 3,100.39). Region XI posted the lowest dealer price in January with Php 2,394.33/bag, while in March it was Region VII (Php 2,430.00/bag). Region XIII had the lowest in April at Php 2,728.01/bag (Table 4).
Table 4. Regional dealer prices of granular urea, February to April 2022.

Ammonium sulfate (21-0-0)
Import Price
Ammonium sulfate or ammosul has been sourced from only three countries over the past months, namely: China, Japan, and Taiwan. The highest volume of imports from February to April were China (37.36% or 1,067.27 MT). Both imports from Japan and Taiwan had substantial amounts of volume, each with around 31% of the total imported volume (Table 5).
In terms of price, ammosul from Japan are priced the lowest at $296.00/MT. Price of imports from Taiwan are slightly expensive at $300.00/MT, while the most expensive are from China ($355.76/MT).
Table 5. Import price and volume of ammonium sulfate, February to April 2022.

On the local side, ammosul average dealer prices are averaged at Php 1,387.57/bag in February, Php 1,403.49/bag in March, and Php 1,439.89/bag in April. The highest dealer prices were recorded in Region V (February – Php 1,506.47), and CAR (March – Php 1,526.24 and April – Php 1,591.87) (Table 6). Lowest prices, on the other hand, were in Regions VIII and XI. In February, ammosul price in Region VIII averaged at Php 1,300.08/bag, while in March, Region XI average dealer price was only at PHP 1,292.32/bag and Php 1,302.22 in April.
Table 6. Regional dealer prices of ammonium sulfate, February to April 2022.

Complete fertilizer (14-14-14)
Import Price
Majority of complete fertilizer imports are from China (9,640.00 MT or 75.79%). The other is from Korea at 24.21% or 3,080.00 MT. Import price per MT is cheaper in Korea ($608.00/MT) than in China ($632.75/MT) (Table 7).
Table 7. Import price and volume of complete fertilizer, February to April 2022.

National average prices of complete fertilizer increased within the three months, reaching Php 1,854.11 in February, Php 1,894.02 in March, and Php 2,103.21 in April (Table 8). However, complete fertilizer has been most expensive in Region V in February and March (Php 1,993.56 and Php 2,037.44, respectively). In the same months, the lowest prices of said fertilizer were recorded in Region XII (Php 1,715.38/bag in February and Php 1,740.50/bag in March). In April, the highest price was recorded in CAR (Php 2,706.80/bag), while Region XIII had the lowest at Php 1,896.06/bag.
Table 8. Regional dealer prices of complete fertilizer, February to April 2022.

Ammonium phosphate
Import Price
Ammonium phosphate or ammophos are imported from China (9,516 MT or 74.25%) and Korea (3,300.00 MT or 25.27%) during the months of February to April totaling to 12,816.00 MT (Table 9). However, the price in Korea ($490.00/MT) is much lower than China ($612/MT).
Table 9. Import price and volume of ammonium phosphate, February to April 2022.

Local dealer prices of national ammophos are averaged at Php 1,631.03 (February), Php 1,684.92 (March), and Php 1,880.47 (April). The lowest prices were observed in Region XII (February – Php 1,464.19 and March – Php 1,496.17), and in REGION XIII in April at Php 1,644.18. On the other hand, Region V (from Php 1,879.05 in February to Php 1,913.04 in March) and CAR (Php 2,363.50 in Apri) posted the highest dealer prices of ammophos (Table 10).
Table 10. Regional dealer prices of ammonium phosphate, February to April 2022.

Muriate of potash
Import Price
During February to April, muriate of potash (MOP) was imported from six countries, namely, Belarus, Canada, Jordan, Laos, Russia, and Uzbekistan (Table 11). The highest volume of imports came from Canada at 19,001.00 MT (55.76%) while the least is from Russia (1,000 MT) and Belarus (500 MT). Moreover, prices of MOP imports are the lowest in Jordan ($570.37/MT), followed by Canada ($583.33/MT).
Table 11. Import price and volume of muriate of potash, February to April 2022.

Regarding national average dealer prices, MOP posted an average price of Php 1,792.00/bag (February), Php 1,832.91 (March), and Php 1,999.63 in April (Table 12).
The regional average dealers lowest price of MOP were observed in Region II (February – Php 1,634.54 and March – Php 1,699.89), and in Region VIII (April – Php 1,853.63). In contrast, the highest dealer prices were noted in Region IX for the three-month period at Php 1,944.27 (February), Php 2,040.48 (March), and Php 2,178.78 in April.
Table 12. Regional dealer prices of muriate of potash, February to April 2022.

Diammonium Phosphate
Import Price
Imports of diammonium phosphate (DAP) were sourced from China (68.60% or 14,420 MT) and Vietnam (6,600 MT) from February to April (Table 13). Import prices from the two countries are lowest in China ($900/MT), while Vietnam is at $990/MT.
Table 13. Import price and volume of diammonium phosphate, February to April 2022.

The national average dealer prices from February to April covers regions IV, VI, VII, VIII, IX, X, XI, XII, and XIII due to non-availability of this fertilizers in other regions (Table 14).
The lowest average dealer prices of DAP were obtained from Region VIII (February – Php 1,883.33); and in Region XIII (March – Php 2,405.81 and April – Php 2,430.00). Highest dealer prices were observed in Region VII (February – Php 2,788.30 and March – Php 2,980.74); and Region XI (April – Php 3,078.26).
Table 14. Regional dealer prices of diammonium phosphate, February to April 2022.

This data shows that prices of each brand is influenced more by the fertilizer’s country of origin and region. The same fertilizer grade with the same brand could have varying prices in the same month, depending on the country of origin and the region of sale. Variation in dealer’s price due to branding is also affected by other factors, such as retail price history, competition, and product cost (Li and Volpe, 2013). Farmers also have a preference for fertilizer brands. According to a study by Briones (2021), the more vital driver of monthly price is the international market rather than local variations in demand.
Import Price
While there are various sources of different fertilizers, cheaper fertilizers can be sourced from certain countries. Lowest prices of prilled urea comes from Uzbekistan ($648.00/MT), granular urea from China ($602.00/MT), ammosul from Japan ($296.58/MT), complete fertilizer from Korea ($608/MT), ammophos from Korea ($490/MT), MOP from Jordan ($570.37/MT), and DAP from China ($900/MT).
Dealers Price
Prilled Urea. On the regional dealer prices of prilled urea, the highest price in February was recorded in Region V (Php 2,673.523), Region VI in March (Php 2906.15), and April (Php 3,118.19). While the lowest prices were recorded in Region I in February (Php 2,380.00) and in Region XIII in March (Php 2,474.31) and April (Php 2,646.24).
Within the 3-month period, the highest average dealer price of prilled urea from Region VI at Php 2,814.83, while the lowest is from Region XIII at Php 2,536.11.
Granular Urea. The highest dealer prices of granular urea were observed in Region IV in February (Php 2,723.00), in Region XIII in March (Php 2,847.29), and in CAR in April (Php 3,100.39). Region XI posted the lowest dealer price in January with Php 2,394.33 per bag, while in March it was Region VII with Php 2,430.00 per bag. Region XIII had the lowest dealer price in April at Php 2,728.01 per bag.
Granular urea average dealer prices in February to April was the highest in Region V with Php 2,826.33 and the lowest in Region VII with Php 2,430.00 (Table 15).
Ammonium Sulfate. Meanwhile, ammosul dealer prices averaged at Php 1,387.57/bag in January, Php 1,403.49/bag in March, and Php 1,439.89/bag in April. The highest dealer prices of ammosul were recorded in Region V in February (Php 1,506.47) and in CAR in March (Php 1,526.24) and April (Php 1,591.87). Lowest prices, on the other hand, were in Regions VIII and XI. In January, ammosul price in Region VIII averaged at Php 1,300.08/bag, while in March, Region XI average dealer price was only at Php 1,292.32/bag and Php 1,302.22 in April.
CAR had the highest average ammosul dealer prices during the 3 months (Php 1,533.65), while Region XI had the lowest (Php 1,302.31) (Table 15).
Complete. Complete fertilizer has been most expensive in Region V in February and March, with average prices of Php 1,993.56 and Php 2,037.44 respectively. In the same months, the lowest prices of complete fertilizer were recorded in Region XII, with Php 1,715.38/bag in February and Php 1,740.50/bag in March. In April, the highest price was recorded in CAR with Php 2,706.80, while Region XIII had the lowest with Php 1,896.06.
Average dealer price of complete fertilizer in CAR is the highest from February to April at Php 2,220.37, while in Region XII is the lowest at Php 1,793.50 (Table 15).
Ammonium Phosphate. Local dealer prices of ammophos averaged at Php 1,631.03 in February, Php 1,684.92 in March, and PHP 1,880.47 in April. Lowest prices were observed in Region XII in February (Php 1,464.19) and March (Php 1,496.17), and in Region XIII in April at Php 1,644.18. On the other hand, Region V and CAR posted the highest dealer prices for ammophos. Prices in Region V averaged to PHP 1,879.05 in February and increased to Php 1,913.04 in March; in CAR, it posted Php 2,363.50 in April.
Ammophos in Region V has the highest average dealer price of ammophos during the three-month period, at Php 1,948.55. Region XII, on the other hand, had the lowest average at Php 1,583.54 (Table 15).
Muriate of Potash. Regarding MOP dealer prices, it posted an average price of Php 1,792.00/bag in February, Php 1,832.91 in March, and PHP 1,999.63 in April. Lowest price of MOP was observed in Region II during February (Php 1,634.54) and March (Php 1,699.89), and in Region VIII in April (Php 1,853.63). In contrast, the highest dealer prices of MOP were recorded in Region IX for the entire three-month period. MOP dealer prices at Region IX were at Php 1,944.27 in February, Php 2,040.48 in March, and rose further to Php 2,178.78 in April.
Region IX recorded the highest average dealer price of MOP with Php 2,054.51, while Region II had the lowest with Php 1,749.20 (Table 15).
Diammonium Phosphate. Comparison of DAP local dealer prices from February to April excludes regions I, II, III, V, and CAR from the analysis due to lack of data. With the data available, it shows that the lowest dealer prices of MOP were obtained from Region VIII in February, at Php 1,883.33; and in Region XIII in March (Php 2,405.81) and April (Php 2,430.00). Highest dealer prices of DAP, on the other hand, were observed in Region VII in February with Php 2,788.30, and March with Php 2,980.74; in Region XI in April with Php 3,078.26.
From February to March, the lowest average dealer price of DAP is from Region VIII at Php 1,883.33, while the highest is from Region VII at Php 2,944.30 (Table 15).
Table 15. Average dealers prices of the six major fertilizer grades per region, February to April 2022.

Recommendations
Given that the country is import dependent, including that of the local manufacturers raw materials 90% imported, notwithstanding the archipelagic situation of our regions which entails high logistical cost, the following recommendations based on this assessment are as follows:
- The government should open up bilateral agreement with countries (G2G) producing fertilizers for lesser acquisition cost.
- Regional dealer’s prices should be based on the source of origin of the fertilizer sold and logistical cost following calculated price matrix approved (Appendix 1).
- The incorporation of Suggested Retail Price (SRP) and Maximum Retail Price (MRP), as per PD 1144 S 1977, on the packs and bags should be institutionalized with the agreement between the Department of Agriculture (DA) and Department of Trade and Industry (DTI). However, the said retail prices should be computed based on the location where the fertilizers are locally sold.
- The adaption of the Calculation of Fertilizer Price Matrix at Various Cost Levels (Appendix 1) should be the basis for DA and DTI impose the SRP and MRP for every import entry.
- The inclusion of Batch and Lot Number in the packs and Bags to determine the entry of this fertilizer, its origin and landed cost.
Other Important Consideration in Mitigating Higher Fertilizer Prices
- Improve monitoring of fertilizer prices from imports to recording or dealer’s prices. The improvement of monitoring of fertilizer imports should require more information from the importers to aid in better record-keeping and estimation of actual prices. This will result in more accurate data and help improve price studies in the future. Moreover, reporting of price values in averages only might not be an accurate representation of the dealer’s prices given the differences in prices per region.
- To further improve the inventory monitoring through the fertilizer, watch system, batch number of importers and local producers should cover source of origin, manufacturing date, date of arrival, and landed cost (for imports).
- Importing companies be urged to coordinate and order bulk imports from certain countries, if possible, to avail of lower prices and discounts and save freight costs. Fertilizers imported at lower prices and less cost will result in cheaper fertilizers available for farmers in the market.
- Provide market assistance in regions where fertilizer is expensive to ensure supply and lower fertilizer prices by reducing additional transportation costs. Further market study should also be conducted at the regional level to assess the possibility of providing the same market intervention while conducting consultations with the stakeholders.
- The practice of balanced fertilization strategy should be introduced to lessen the impact of high fertilizer prices. The use of alternatives like organic, microbial, and biorational fertilizers, will also be explored to lessen dependence on chemical fertilizers.
Acknowledgment
The authors acknowledge the Field Operations and Coordination Unit (FOCU), Regional Field Units, and Fertilizer Regulatory Division (FRD) of the FPA for the data required in this study. To the Special Area for Agricultural Development (SAAD) farmers and fishers who voice there clamor on this issue.
References
Baffes, J. and Koh, W.C. (2021, June 8). Fertilizer prices expected to stay high over the remainder of 2021. World Bank Blogs. Retrieved from https://blogs.worldbank.org/opendata/fertilizer-prices-expected-stay-high-over-remainder-2021
Briones, R. (2021). Issues paper on the Philippine fertilizer industry. Quezon City, Philippines: Philippine Competition Commmission.
Li, C. and Volpe, R. (2013). Retail pricing patterns and driving factors of price variation. Paris, France: 88th Annual Conference, AgroParisTech.
Mula Myer (2022). Analysts expect global fertilizer to remain high in 2022 and what the OneDA response. Special Area for Agricultural Development (SAAD) Program. SAADvocacy 4(1):6. ISSN 2718-9791.
Roldan W, Mula M, Lansangan J, Reyes R and Layag I (2021). Rising fertilizer prices: A reality. Special Area for Agricultural Development (SAAD) Program. SAADvocacy 3(12):4 & 8. ISSN 2718-9791.
*View the whole study attachment on this link: https://saad.da.gov.ph/fpa-fertilizer-price-assessment-by-country-vis-a-vis-dealers-price-an-outlook


Comments (0)